
Canadian Insider Index approaches decision point
The INK Canadian Insider (CIN) Index has shed 7 points or about 1% since our last update, not a major development, since the Index has trended sideways, close to its 200 day moving average, for several weeks.
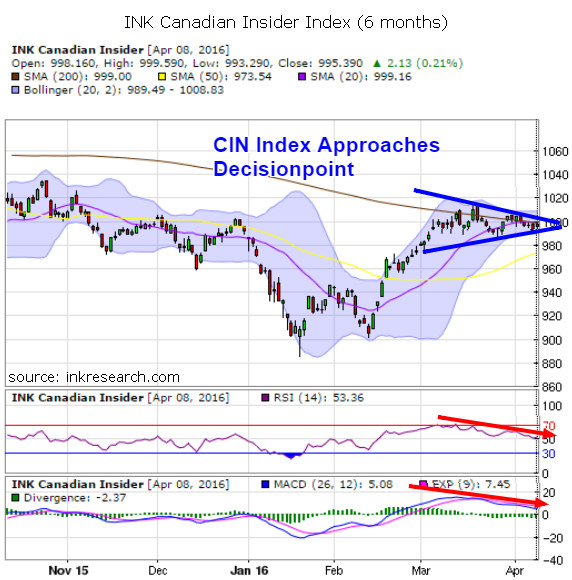
The Index is forming a triangular wedge pattern that suggests a trend change is likely approaching. The Index will either fail to break through resistance one last time and correct downward, or the Index will finally escape the heavy shackles of the 1000-1010 level and begin a new uptrend.
There are arguments for both cases. On the bull side, the Index has rebounded powerfully, rising 13% from its January lows, and this recent sideways action can be seen as a consolidation of that massive rally, ahead of its next advance. On the bear side, the Index has literally made zero headway in the last 5 weeks and technical momentum appears to be waning.
On the momentum front, we report that both indicators turned down this week, with RSI falling nearly 20% to 53.36 from 60.76. More importantly, RSI, our near-term momentum indicator, has bearishly made lower highs since about mid-March, closing the week at 53.36. MACD, the slower, more long-term momentum indicator, is also looking lethargic and currently reads 7.45, more than 50% below its March high of 15.50.
At present, major resistance is at 1005-1010, while minor resistance is 1000. Major support is 988-990 and minor support is at 995.
The diverging paths of the Index and its momentum indicators suggest that unless the Index stages a strong rally soon, a pullback and breakdown for the Index may be in the cards.
bridgemedia | Women's Nike Air Force 1 Shadow trainers - Latest Releases , Ietp
Category:
- Please sign in or create an account to leave comments
Please make the indicated changes including the new text: US quotes snapshot data provided by IEX. Additional price data and company information powered by Twelve Data.