
Can insider stocks slingshot through resistance?
Technical Overview by Nicholas Winton, Hedgehog Trader and @HedgehogTrader on Twitter
Thank you for joining us for our regular technical look at the mid-cap oriented INK Canadian Insider (CIN) Index. The index remained resilient this past week, holding above its 20 day moving average.
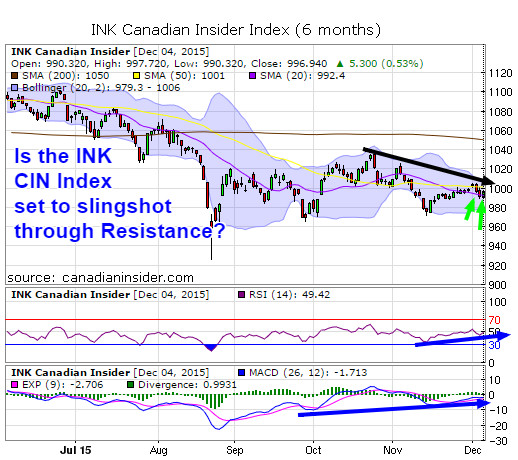
We have now seen two successful tests of this support line (see the two green arrows) and it's looking as though the Index may attempt to slingshot from this base in an attempt to meaningfully break the 1000 point level for the first time in several weeks.
What's interesting is the top Bollinger band has dropped sharply in the last few weeks from the high 1030s down to about the 1010 level. What's significant is that the top Bollinger band has been a major source of resistance and now with the index trading just a hair below, the index has a great opportunity to finally break through this wall.
MACD and RSI support the possibility of a rally, as they remain in an uptrend - even a small burst in momentum would send RSI above the key 50 point level, an event that would likely eject the Index out of its month-long 960 to 1000 level trading range. If the index fails to break through, it still remains in a bullish consolidation so long as it remains above the 980 level. At this point, there is very little reason to doubt the multi-month trend of higher lows won't continue.
Support remains at 980 and 992. Resistance is at 1000 and 1010.
Mysneakers | Buy Yeezy Slides 'Core' - Kanye West x Adidas — Ietp
Category:
- Please sign in or create an account to leave comments
Please make the indicated changes including the new text: US quotes snapshot data provided by IEX. Additional price data and company information powered by Twelve Data.