
Anaconda Mining Announces Significant Increase to the Mineral Resources at the Goldboro Gold Project
TORONTO, ON / ACCESSWIRE / February 22, 2021 / Anaconda Mining Inc. ("Anaconda" or the "Company") (TSX:ANX)(OTCQX:ANXGF) is pleased to announce an updated and significantly expanded Mineral Resource Estimate ("Mineral Resource") prepared in accordance with National Instrument 43-101 ("NI 43-101") for its 100% owned Goldboro Gold Project in Nova Scotia, Canada ("Goldboro", or the "Project") (Exhibit A). With an effective date of February 7, 2021, this updated Mineral Resource demonstrates the potential to meaningfully expand the scale of the Project, especially the surface mining potential from open pits (Exhibits A - E). The Mineral Resource will form the basis of the mine plan to be outlined in a Feasibility Study anticipated to be announced in Q4 2021.
Highlights of the Goldboro Gold Project Updated Mineral Resource
- 1,089,800 ounces of gold (11,880,000 tonnes at 2.86 grams per tonne ("g/t") gold) within two constrained open pits within the Measured and Indicated Mineral Resource categories, representing an increase in ounces of 1,361%;
- Overall, 1,946,100 ounces of gold (16,036,000 tonnes at an average grade of 3.78 g/t gold) within the Measured and Indicated Mineral Resource categories, representing a 179% increase in combined open pit and underground ounces;
- 798,100 ounces of gold (5,306,000 tonnes at 4.68 g/t gold) within the Inferred Mineral Resource category; a 16% increase in combined open pit and underground;
- Feasibility level metallurgical studies demonstrate an excellent average recovery of 96% for the open pit constrained Mineral Resource (see press release dated February 9, 2021).
- Continued growth potential as the open pit shells only used Measured and Indicated Resources to create the open pit physical limits, strong opportunity exists for further conversion of Inferred Resources.
The significant increase in the size of the Mineral Resource at Goldboro represents a step-change for the economic potential of the Project, especially with over one million ounces of Measured and Indicated Resources within constrained open pits. Consequently, in addition to the ongoing Feasibility Study to be announced in Q4 2021, the Company has initiated a Preliminary Economic Assessment ("PEA") for Goldboro. The PEA will incorporate the updated Mineral Resource and feasibility work conducted to date, allowing the Company to demonstrate and discuss the economic potential of this significantly larger Project to all stakeholders.
"We are pleased to announce the significantly expanded Mineral Resource for the Goldboro Gold Project, which we believe is quickly transforming into a top-tier gold deposit. The expanded Mineral Resource is the culmination of nearly a year of effort that started with recognizing the massive potential of near-surface mineralization which is amenable to surface mining, which led to many months of updated geological modelling and incorporation of recent infill drilling campaigns, giving special attention to the broad zones of mineralization across a range of gold grades and their geological domains. With 1,089,800 ounces of Measured and Indicated Resources within constrained open pits, and metallurgical recoveries of 96% based on feasibility level studies, it is clear this Project is quickly developing into a sizeable gold deposit. We are excited to initiate a PEA for Goldboro, in parallel with the Feasibility Study, to demonstrate the economic potential of Goldboro and its ability to support the Company's growth strategy to become a 150,000 ounce per year gold producer."
~Kevin Bullock, President and CEO, Anaconda Mining Inc.
Table 1 summarizes the updated Mineral Resource and the comparative changes from the Previous Mineral Resource (as defined below).
Table 1: Mineral Resource Statement for the Goldboro Gold Project with Comparison with Previous Mineral Resource
Category | Tonnes* | Gold Grade* | Troy Ounces* | % Change in Tonnes | % Change in Ounces |
('000) | (g/t) | from August 2019** | from August 2019** | ||
Measured | 7,521 | 3.58 | 866,200 | + 315% | + 240% |
Indicated | 8,515 | 3.95 | 1,079,900 | + 273% | + 143% |
Measured + Indicated | 16,036 | 3.78 | 1,946,100 | + 292% | + 179% |
Inferred | 5,306 | 4.68 | 798,100 | + 76% | + 16% |
* Combined Open Pit and Underground Mineral Resources. Open Pit Mineral Resource based on a 0.44 g/t Au cut-off grade; Underground Mineral Resource based on 2.60 g/t Au cut-off grade.
** Refer to the Company's technical report entitled "Anaconda Mining Inc., Goldboro Gold Project Resource Update Phase 2, Guysborough County, NS" with an effective date of October 31, 2019 and report filing date of December 18, 2019 ("Previous Mineral Resource").
Goldboro Gold Project - Mineral Resource Estimate
The Mineral Resource, presented in Table 2, was prepared by Independent Qualified Person, Glen Kuntz, P. Geo. of Nordmin Engineering Ltd. ("Nordmin") of Thunder Bay, Ontario. The Mineral Resource is based on validated results of 635 surface and underground drill holes, for a total of 113,132.9 metres of diamond drilling that was completed between 1984 and the effective date of February 7, 2021. The Mineral Resource includes 45,408.7 metres of drilling conducted by Anaconda including 17,941.7 metres of diamond drilling in 121 holes since the Previous Mineral Resource estimate of August 21, 2019. Nine diamond drill holes totaling 1,001.9 metres were removed from the database due to inconsistent sample lengths.
Table 2: Mineral Resource Statement for the Goldboro Gold Project
Resource Type | Gold Cut-off (g/t) | Category | Tonnes ('000) | Gold Grade (g/t) | Troy Ounces |
Open Pit | 0.44 | Measured | 6,137 | 2.73 | 538,500 |
Indicated | 5,743 | 2.99 | 551,300 | ||
Measured + Indicated | 11,880 | 2.86 | 1,089,900 | ||
Inferred | 1,580 | 1.75 | 89,000 | ||
Underground | 2.60 | Measured | 1,384 | 7.36 | 327,700 |
Indicated | 2,772 | 5.93 | 528,600 | ||
Measured + Indicated | 4,156 | 6.41 | 856,200 | ||
Inferred | 3,726 | 5.92 | 709,100 | ||
Combined* | 0.44/2.60 | Measured | 7,521 | 3.58 | 866,200 |
Indicated | 8,515 | 3.95 | 1,079,900 | ||
Measured + Indicated | 16,036 | 3.78 | 1,946,100 | ||
Inferred | 5,306 | 4.68 | 798,100 |
* Combined Open Pit and Underground Mineral Resources; The Open Pit Mineral Resource is based on a 0.44 g/t gold cut-off grade, and the Underground Mineral Resource is based on 2.60 g/t gold cut-off grade.
Mineral Resource Estimate Notes
- Mineral Resources were prepared in accordance with NI 43-101 and the CIM Definition Standards for Mineral Resources and Mineral Reserves (2014) and the CIM Estimation of Mineral Resources and Mineral Reserves Best Practice Guidelines (2019). Mineral Resources that are not mineral reserves do not have demonstrated economic viability. This estimate of Mineral Resources may be materially affected by environmental, permitting, legal, title, taxation, sociopolitical, marketing, or other relevant issues.
- Open Pit Mineral Resources are reported at a cut-off grade of 0.44 g/t gold that is based on a gold price of CAD$2,000/oz (~US$1,550/oz) and a gold processing recovery factor of 96%.
- Underground Mineral Resource is reported at a cut-off grade of 2.60 g/t gold that is based on a gold price of CAD$2,000/oz (~US$1,550/oz) and a gold processing recovery factor of 97%.
- Assays were variably capped on a wireframe-by-wireframe basis (Table 5).
- Specific gravity was applied using weighted averages to each individual wireframe.
- Mineral Resource effective date February 7, 2021.
- All figures are rounded to reflect the relative accuracy of the estimates and totals may not add correctly.
- Excludes unclassified mineralization located within mined out areas.
- Reported from within a mineralization envelope accounting for mineral continuity.
Input Parameters for Mineral Resource Calculation
Open Pit
For the open pit Mineral Resource (Table 2 and Exhibit A), a pit limit analysis was undertaken using the Lerchs-Grossmann ("LG") algorithm in Geovia's Whittle™ 4.7 software to determine physical limits for a pit shell constrained Mineral Resource. The parameters used to generate a pit shell are shown in Table 3.
Table 3: Physical Pit Limit Analysis Parameters
PARAMETER | VALUE |
Currency Used for Evaluation | C$ |
Block Size | In-situ model reblocked to 2 m x 2 m x 5 m |
Overall Slope Angle | Rock: Varied by Sector - Range 42o - 50o Overburden: 25o |
Mining Cost | 3.50$/tmined Overburden 5.00$/tmined Rock + 0.02$/t per 10 m for depths between 100 - 200 m + 0.03$/t per 10 m for depths +200 m |
Process Cost includes assumptions for Milling, G&A, tailings, rehabilitation | 24.50$/tprocessed |
Selling Cost includes dore transportation, refining, and royalty | 24.84$/troy ounce ("t.oz") |
% Payable | 99.95% |
Metal Price | 1,550 US$/t.oz. Exchange Rate 1US$: 1.3C$ 2,000 C$/t.oz.(rounded) |
Process Recovery | Based on Grade - Recovery Curve (Block Grade -(0.0262*LN (Block Grade)+0.0712))/Block Grade*100-0.083 Average Recovery 96% |
Resources Used to Generate Pit Shell | Measured + Indicated (no Inferred Resources were used to create the open pit physical limits) |
Pit Shell Selection | Revenue Factor RF 0.76 |
Production Rate Assumption | 4,000 tonne per day |
The milling cut-off grade is used to classify the material contained within the pit shell limits as open pit resource material. This break-even cut-off grade is calculated to cover the Process and Selling Costs using the parameters listed in Table 3. The open pit Mineral Resource cut-off grade is estimated to be 0.44 g/t gold. For resource cut-off calculation purposes, a mining recovery of 100% and 0% mining dilution were applied.
Underground
For the underground Mineral Resource (Table 2), the parameters used to calculate the cut-off grade are shown in Table 4. The underground Mineral Resource cut-off grade is estimated to be 2.60 g/t gold. For resource cut-off calculation purposes, a mining recovery of 100% and 0% mining dilution were applied.
Table 4: Underground Mineral Resource Cut-off Grade Parameters
PARAMETER | VALUE |
Currency Used for Evaluation | C$ |
Underground Mining Cost includes assumptions for operating waste development, surface rehandle | 96.25$/tprocessed |
Process Cost includes assumptions for Milling, G&A, tailings, indirect costs | 44.30$/tprocessed |
Underground Support Cost Includes assumptions for sustaining underground capital, infill diamond drilling | 22.50$/tprocessed |
Selling Cost includes dore transportation, refining, and royalty | 24.84$/t.oz. |
% Payable | 99.95% |
Metal Price | 1,550 US$/t.oz. Exchange Rate 1US$: 1.3CA$ 2,000 C$/t.oz.(rounded) |
Process Recovery | 97% |
Production Rate Assumption | 1,200 tonne per day |
Geological Domaining
Nordmin, through an interactive process with Anaconda, undertook a full re-examination of the mineralogical, lithological, structural, and geochemical correlations influencing the higher-grade and lower-grade gold areas within the Project. Gold mineralization at the Project occurs in both quartz veins and within the argillite that hosts the veins and within the rocks adjacent to the modelled argillites and quartz veins, including both lesser argillite with greywacke. Disseminated, euhedral arsenopyrite is pervasively associated with gold mineralization. It is commonly observed within the host rock and is usually present in mineralized quartz veins. Wall rock generally contains more pyrrhotite and arsenopyrite than directly associated quartz veins.
The Deposit consists of three domains referred to as the Boston Richardson ("BR"), East Goldbrook ("EG"), and West Goldbrook ("WG") Gold Systems (Exhibit A). The WG Gold System is separated from the BR Gold System by a north trending, near vertical fault with tens of metres of apparent offset. The EG Gold System is separated from the BR Gold System by a thick greywacke sequence or marker unit. Stratigraphic younging is from west to east with the anticlinal fold plunging shallowly to the east.
From a modelling perspective, each of the Deposit Gold Systems was separated into its own domain. Each domain was further subdomained into High-Grade Mineralized "Belts" and Low-Grade Mineralized Zones.
In 2020, Anaconda completed 121 infill drill holes (17,941.7 m) across these three domains and within approximately the top 225 m of surface. Nordmin utilized these infill drill holes and reviewed the lithological, structural, spatial mineralization controls and grade variances within the Project. The review concluded that each domain required extensive remodeling of the tightly folded higher-grade mineralized belts and the creation of a new lower-grade mineralized zone that encapsulates the mineralized belts. Previously, the significance of the lower-grade zones was not correctly understood and not included within previous resource estimates. The combination of higher-grade mineralized belts and lower-grade mineralized zones supports the estimation of grade between the higher-grade belts and therefore can be applied to support various surface and underground mining methods.
Detailed wireframing was completed based on plan-oriented sections to mirror likely mining patterns based on the geometry of the Deposit. Special attention was given to consistent smoothing of the wireframe linework to mimic the underlying geological controls on mineralization, including geological bedding, regularly dipping north and south limbs of the large-scale anticlinal fold geometry and down the plunge of the anticline. Historical workings of three underground mines, which traced the outline of the fold geometry down the fold plunge and along anticlinal limbs coincident with gold mineralization, were also used to orient wireframes. Previously, wireframes were created between 10 m to 25 m cross-sections and joined section to section resulting in irregular geometries and plunge lines not representative of the underlying geology. All wireframes are independent of each other without overlap across wireframes or across domains.
Explicit modelling was used to create the Mineral Resource, which allows for mineralization to better reflect the Deposit geology and associated geochemistry. Nordmin's opinion is that the explicit modelling approach minimizes risks compared to using implicit modelling for the Project.
Compositing
Compositing of assays is a technique used to give each sample a relatively equal length to reduce the potential for bias due to uneven sample lengths; it prevents the potential loss of sample data and reduces the potential for grade bias due to the possible creation of short and potentially high-grade composites that are generally formed along the zone contacts when using a fixed length.
The raw assay data was manually "flagged" to intersecting belts and low-grade zones. Each belt and low-grade zone's flagged assays were statistically analyzed to define appropriate capping, modelling procedures, and parameters. Nordmin reviewed the previous historical estimate capping method and determined the global 80 g/t gold cap was not representative of the gold distribution for the entire Deposit. Therefore, the assays were variably capped to prevent excessive high-grade from skewing the estimation in each wireframe (Table 5). The overall difference between an 80 g/t gold cap and a variable cap is less than 2% over the entire Deposit.
Table 5: Assay Capping on a Wireframe-By-Wireframe Basis
West Goldbrook | Boston Richardson | East Goldbrook | ||||||
Belt | Type | Au Cap (g/t) | Belt | Type | Au Cap (g/t) | Belt | Type | Au Cap (g/t) |
1 | DDH | No cap | 1 | Chip | 100 | 1 | DDH | No cap |
2 | DDH | 80 | DDH | 75 | 2 | DDH | No cap | |
3a | DDH | No cap | 2 | Chip | 95 | 3 | DDH | 120 |
3b | DDH | No cap | DDH | 70 | 4 | DDH | 50 | |
4 | DDH | No cap | 3 | Chip | 95 | 4a | DDH | No cap |
5 | DDH | No cap | DDH | No cap | 4b | DDH | 120 | |
5a | DDH | 100 | 3a | DDH | 210 | 5 | DDH | 120 |
5b | DDH | No cap | 4 | DDH | 40 | 5a | DDH | 80 |
6 | DDH | No cap | 4a | DDH | No cap | 6 | DDH | 120 |
6a | DDH | 50 | 5 | DDH | 120 | 7 | DDH | 30 |
6b | DDH | No cap | 5a | DDH | 120 | 8 | DDH | 56 |
7 | DDH | No cap | 6 | DDH | 120 | 9 | DDH | 120 |
8 | DDH | 70 | 7 | DDH | 75 | 10 | DDH | No cap |
9 | DDH | No cap | 8 | DDH | 55 | 10a | DDH | No cap |
10 | DDH | No cap | 9 | DDH | No cap | 11 | DDH | 120 |
11 | DDH | No cap | 10 | DDH | 60 | 11a | DDH | No cap |
Low Grade | DDH | No Cap | 11 | DDH | 100 | 12 | DDH | 120 |
12 | DDH | No cap | 12a | DDH | No cap | |||
13 | DDH | No cap | 13 | DDH | 50 | |||
Low Grade | DDH | No cap | 13a | DDH | No cap | |||
14 | DDH | 50 | ||||||
14a | DDH | 120 | ||||||
15 | DDH | 80 | ||||||
15a | DDH | No cap | ||||||
15b | DDH | No cap | ||||||
16 | DDH | 120 | ||||||
17 | DDH | 40 | ||||||
18 | DDH | 80 | ||||||
19 | DDH | 80 | ||||||
20 | DDH | 80 | ||||||
21 | DDH | No cap | ||||||
22 | DDH | 80 | ||||||
23 | DDH | 80 | ||||||
24 | DDH | No cap | ||||||
25 | DDH | 80 | ||||||
Marker | DDH | No Cap | ||||||
Low Grade | DDH | 5 | ||||||
The raw sample data was found to have a moderately consistent range of sample lengths. Samples captured within all zones were composited to 1.0 m regular intervals based on the observed modal distribution of sample lengths, supporting a 2.0 m x 2.0 m x 2.0 m (Northing x Easting x Elevation) block model with three sub-blocking levels (Northing = 0.25 m x Easting = 0.25 m x variable elevation). An option to use a slightly variable composite length was chosen to allow for backstitching shorter composites located along the edges of the composited interval. All composite samples were generated within each high-grade mineralized belt and lower-grade mineralized zones. There are no overlaps along boundaries. The composite samples were statistically validated to ensure no material loss of data or change to each sample population's mean grade.
Block Model Resource Estimation
A series of upfront test modelling was completed to define an estimation methodology to meet the following criteria:
- Representative of the deposit geology, structural models and geological controls on mineralization.
- Accounts for the variability of grade, orientation, and continuity of mineralization.
- Controls the smoothing (grade spreading) of grades and the influence of outliers.
- Accounts for most of the mineralization.
- Is robust and repeatable within the domains.
- Supports multiple high-grade belts and low-grade zones.
Multiple test scenarios were evaluated to determine the optimum processes and parameters to achieve the stated criteria. Each scenario incorporated nearest neighbour, inverse distance squared, inverse distance cubed, and ordinary kriging interpolation methods.
All test scenarios were evaluated based on global statistical comparisons, visual comparisons of composite samples versus block grades, and overall smoothing assessment. Based on the testing results, it was determined that the draft and final resource estimation methodology would constrain the mineralization by using hard wireframe boundaries to control the spread of high-grade and low-grade mineralization. Ordinary kriging was selected as the most representative interpolation method.
Search Strategy and Estimation
Zonal controls were used to constrain the grade estimates to each wireframe. These controls prevented the samples from individual wireframes from influencing others' block grades, acting as a "hard boundary" between the wireframes.
The search orientation strategy determined to be most representative of the mineralization at the Deposit was to use a combination of an overall search ellipsoid for each domain and to allow dynamic anisotropy in the estimation process. Dynamic anisotropy is a search adjustment applied to estimation, which considers local variation of the wireframe orientation. The dynamic anisotropy approach was applied to the three Gold Systems and adjusts the search ellipsoid on a block-to-block basis controlled by the orientation for all mineralized wireframes. Nordmin's opinion is that dynamic anisotropy allows for a much more accurate estimation of grade and mineralization due to the tightly folded nature of mineralized belts and lower-grade mineralized zones.
Estimation passes were defined with carefully-selected search distances. The first pass is correlated to a Measured categorization, the second pass correlated to an Indicated categorization, and the third pass correlated to an Inferred categorization. These three passes of increasing distances were as follows (major axis x semi-major axis x minor axis).
High-Grade Mineralized Belts:
- First Pass: 25 m x 15 m x 10 m
- Second Pass: 31.3 m x 18.8 m x 12.5 m
- Third Pass: 150 m x 90 m x 60 m
Lower-Grade Mineralized Zones:
- First Pass: 15 m x 10 m x 5 m
- Second Pass: 18.8 m x 12.5 m x 6.3 m
- Third Pass: 60 m x 40 m x 20 m
Assessment of Spatial Grade Continuity
Datamine and Sage 2001 was used to determine the geostatistical relationships of the Deposit. Independent variography was performed on composite data for each wireframe in each domain. Experimental grade variograms were calculated from the capped/composited sample gold data to determine the approximate search ellipse dimensions and orientations.
The analyses considered the following:
- Downhole variograms were created and modelled to define the nugget effect;
- Experimental pairwise-relative correlogram variograms were calculated to determine directional variograms for the strike and down dip orientations;
- Variograms were modelled using an exponential with practical range;
- Directional variograms were modelled using the nugget defined in the downhole variography and the ranges for the along strike, perpendicular to strike, and down dip directions;
- Variograms outputs were re-oriented to reflect the orientation of the mineralization; and
- The analysis demonstrated that gold continuity could be appropriately defined by one main variogram across all domains.
Classification
The Mineral Resource was classified in accordance with the 2014 CIM Definition Standards and 2019 CIM Best Practice Guidelines. Mineral Resource classifications (Exhibit D) or "categories" were assigned to regions of the block model based on the Qualified Person's ("QP") confidence and judgement related to geological understanding, continuity of mineralization in conjunction with data quality, spatial continuity based on variography, estimation pass, data density, and block model representativeness, specifically assay spacing and abundance, kriging variance, and search volume block estimation assignment.
The classification was initially applied from the estimation pass. Blocks populated in pass 1 were classified as Measured, blocks populated in pass 2 were classified as Indicated, and blocks populated in pass 3 were classified as Inferred. Subsequently, each domain block model was analyzed, and it was determined that several classification adjustments were required. These adjustments were as follows:
- Independent wireframes were built within specific areas that have relatively low drill density and/or high kriging variance. All material within these wireframes were classified as Inferred; and
- Specific areas that contain lower-grade mineralized zones with a Measured or Indicated classification were downgraded to a lower classification in areas with poor drill density toward the bottom of the modelled Deposit.
Technical Report and Qualified Persons
A Technical Report prepared in accordance with NI 43-101 for the Goldboro Gold Project will be filed on SEDAR (www.sedar.com) before March 31, 2021. Readers are encouraged to read the Technical Report in its entirety, including all qualifications, assumptions and exclusions that relate to the Mineral Resource. The Technical Report is intended to be read as a whole, and sections should not be read or relied upon out of context.
The Mineral Resource estimate was independently prepared under the supervision of Mr. Glen Kuntz, P.Geo. (Ontario) of Nordmin Engineering Ltd., a "Qualified Person" under National Instrument 43-101 Standards of Disclosure for Mineral Projects. Verification included a site visit to inspect drilling, logging, density measurement procedures and sampling procedures, and a review of the control sample results used to assess laboratory assay quality. In addition, a random selection of the drill hole database results was compared with original records.
This news release has been reviewed and approved by Paul McNeill, P. Geo., VP Exploration with Anaconda Mining Inc., a "Qualified Person", and Glen Kuntz, P. Geo. (Ontario) of Nordmin Engineering Ltd., an "Independent Qualified Person" under National Instrument 43-101 Standard for Disclosure for Mineral Projects.
ABOUT ANACONDA
Anaconda is a TSX and OTCQX-listed gold mining, development, and exploration company, focused in Atlantic Canada. The company operates mining and milling operations in the prolific Baie Verte Mining District of Newfoundland which includes the fully-permitted Pine Cove Mill, tailings facility and deep-water port, as well as ~15,000 hectares of highly prospective mineral lands including those adjacent to the past producing, high-grade Nugget Pond Mine at its Tilt Cove Gold Project. Anaconda is also developing the Goldboro Gold Project in Nova Scotia, a high-grade resource and the subject of an on-going feasibility study.
FORWARD-LOOKING STATEMENTS
This news release contains "forward-looking information" and "forward looking statements" within the meaning of applicable Canadian and United States securities legislation, including but not limited to, statements with respect to timing of the PEA and Feasibility Study, exploration results, project development, mineral resource estimates, and other plans and activities of Anaconda. Generally, forward-looking information can be identified by the use of forward-looking terminology such as "plans", "expects", or "does not expect", "is expected", "budget", "scheduled", "estimates", "forecasts", "intends", "anticipates", or "does not anticipate", or "believes" or variations of such words and phrases or state that certain actions, events or results "may", "could", "would", "might", or "will be taken", "occur", or "be achieved". Forward-looking information is based on the opinions and estimates of management at the date the information is made, and is based on a number of assumptions and is subject to known and unknown risks, uncertainties and other factors that may cause the actual results, level of activity, performance or achievements of Anaconda to be materially different from those expressed or implied by such forward-looking information, including risks associated with the exploration, development and mining such as economic factors as they effect exploration, future commodity prices, changes in foreign exchange and interest rates, actual results of current production, development and exploration activities, government regulation, political or economic developments, environmental risks, permitting timelines, capital expenditures, operating or technical difficulties in connection with development activities, employee relations, the speculative nature of gold exploration and development, including the risks of diminishing quantities of grades of resources, contests over title to properties, and changes in project parameters as plans continue to be refined as well as those risk factors discussed in Anaconda's annual information form for the year ended December 31, 2019, available on www.sedar.com. Although Anaconda has attempted to identify important factors that could cause actual results to differ materially from those contained in forward-looking information, there may be other factors that cause results not to be as anticipated, estimated or intended. There can be no assurance that such information will prove to be accurate, as actual results and future events could differ materially from those anticipated in such information. Accordingly, readers should not place undue reliance on forward-looking information. Anaconda does not undertake to update any forward-looking information, except in accordance with applicable securities laws.
FOR ADDITIONAL INFORMATION CONTACT:
Anaconda Mining Inc.
Kevin Bullock
President and CEO
(647) 388-1842
[email protected]
Reseau ProMarket Inc.
Dany Cenac Robert
Investor Relations
(514) 722-2276 x456
[email protected]
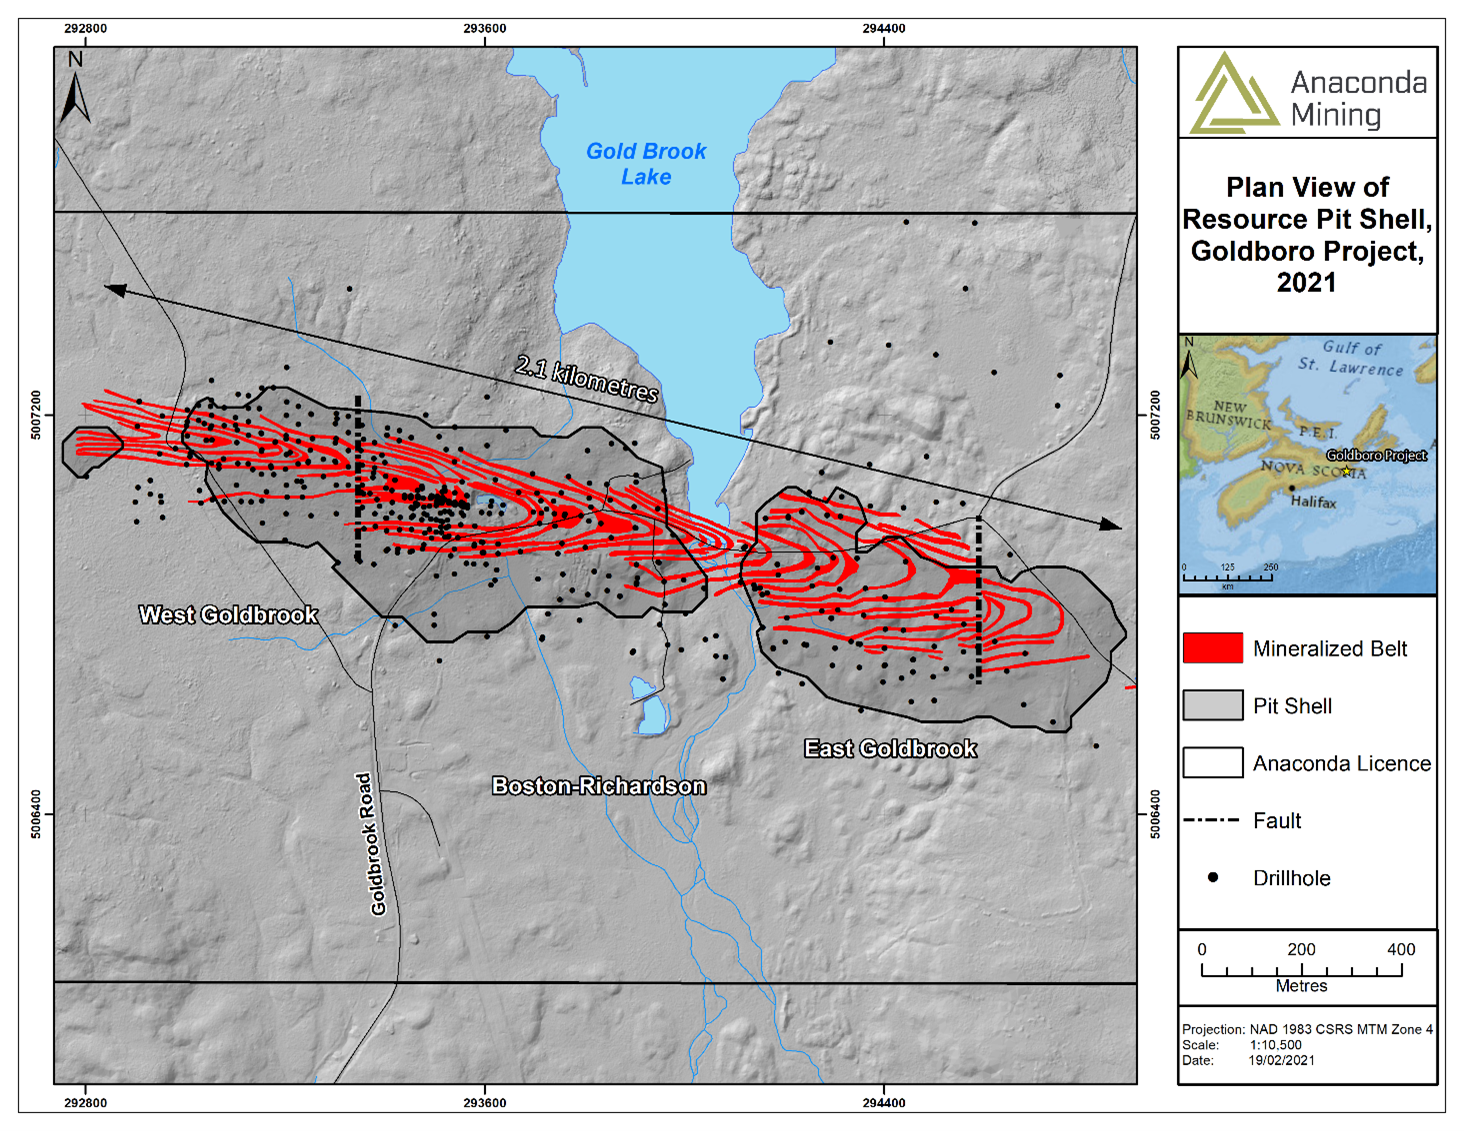
Exhibit A. The location of the Goldboro Gold Project showing the Goldboro deposit and open pits that constrain the open pit portion of the Mineral Resource.
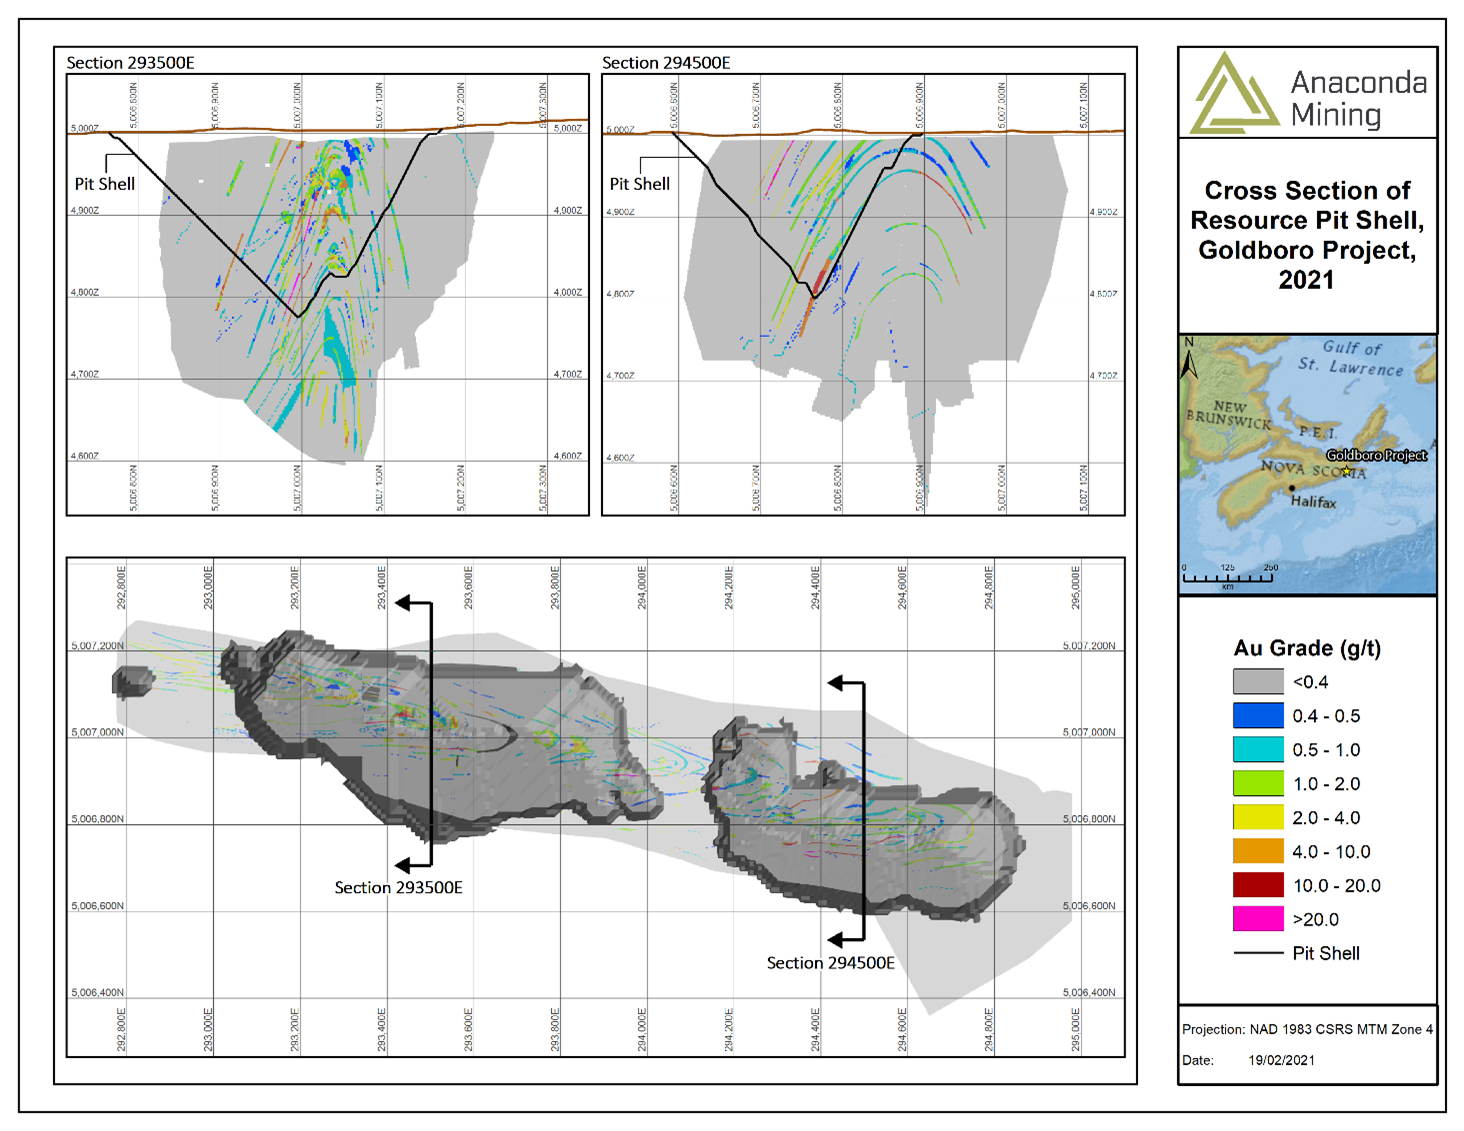
Exhibit B. A map and two cross sections showing the Mineral Resource within and outside the constraining open pits.
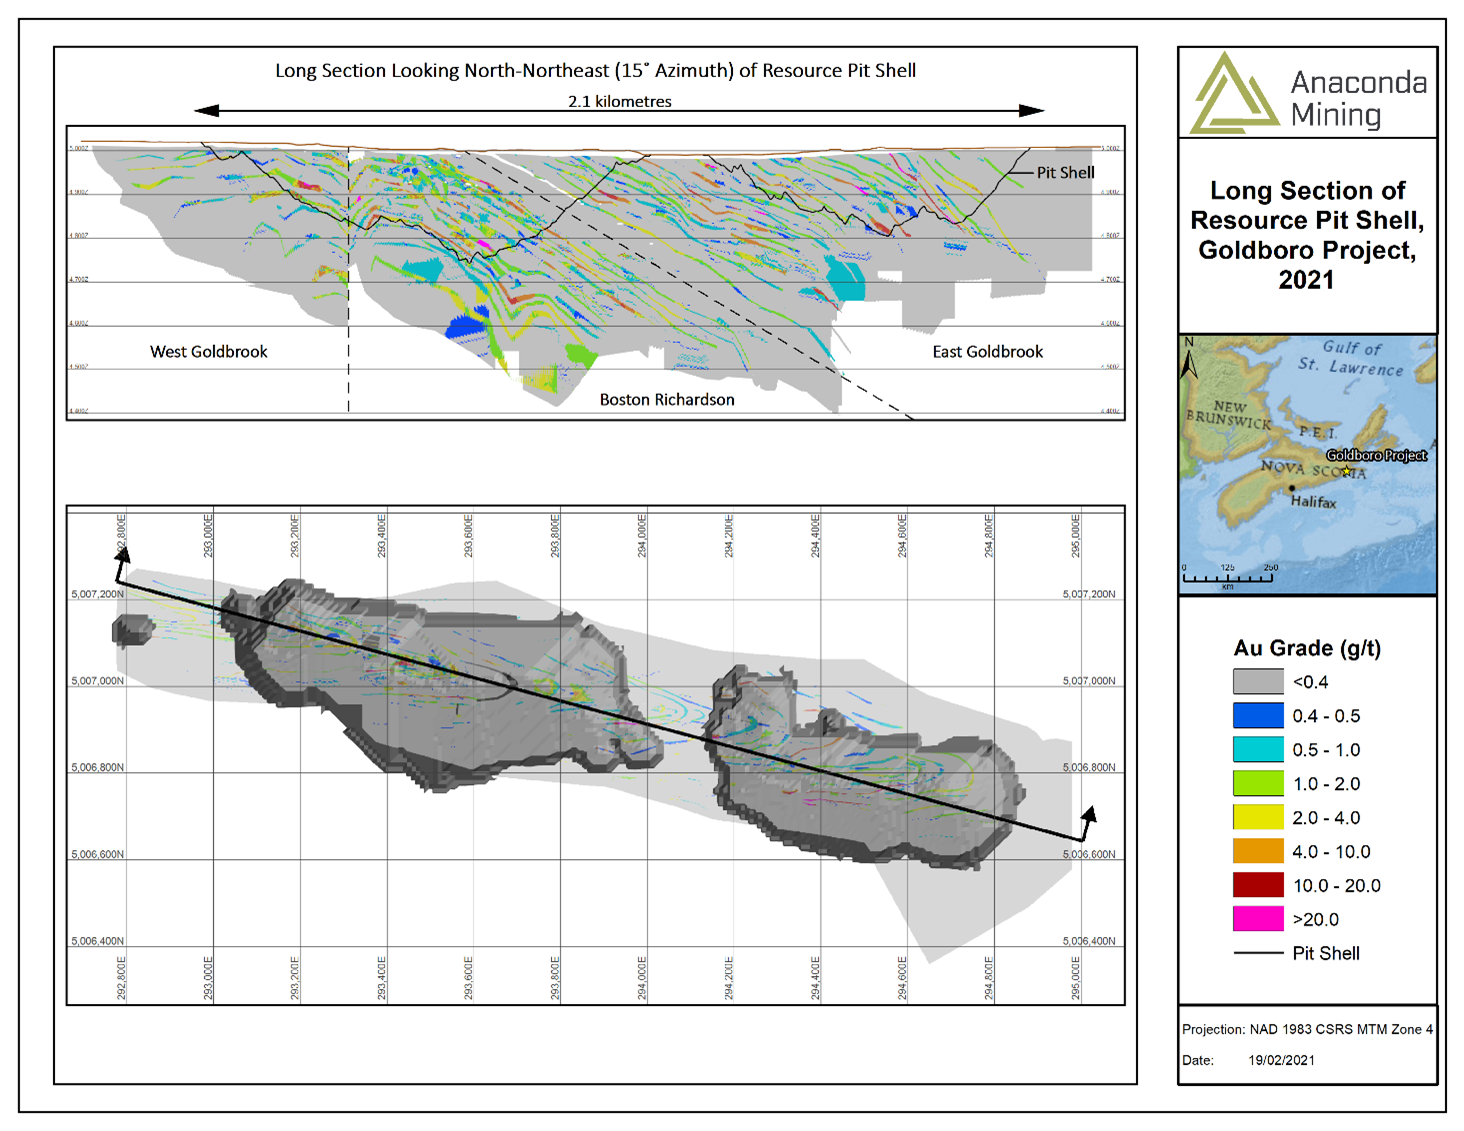
Exhibit C. A map and long section through the Goldboro Deposit showing gold distribution and the location of the constrained open pits.
|
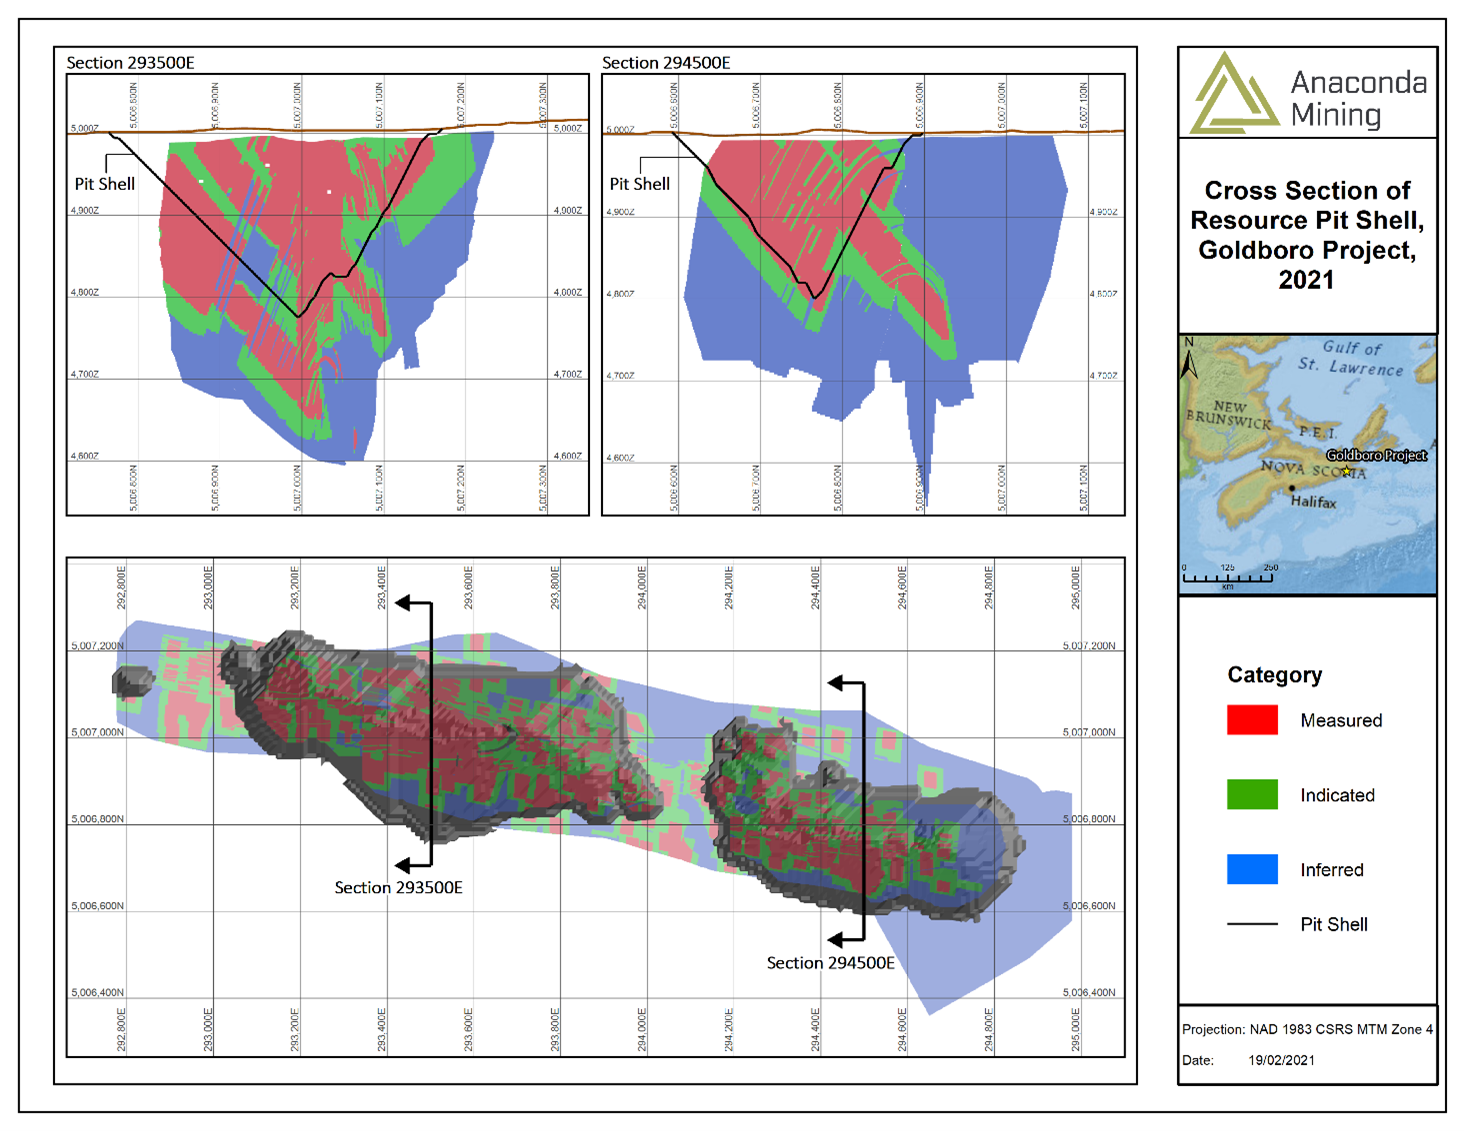
Exhibit D. A map and two cross sections showing the Mineral Resource as resource categories within and outside of the constrained open pits.
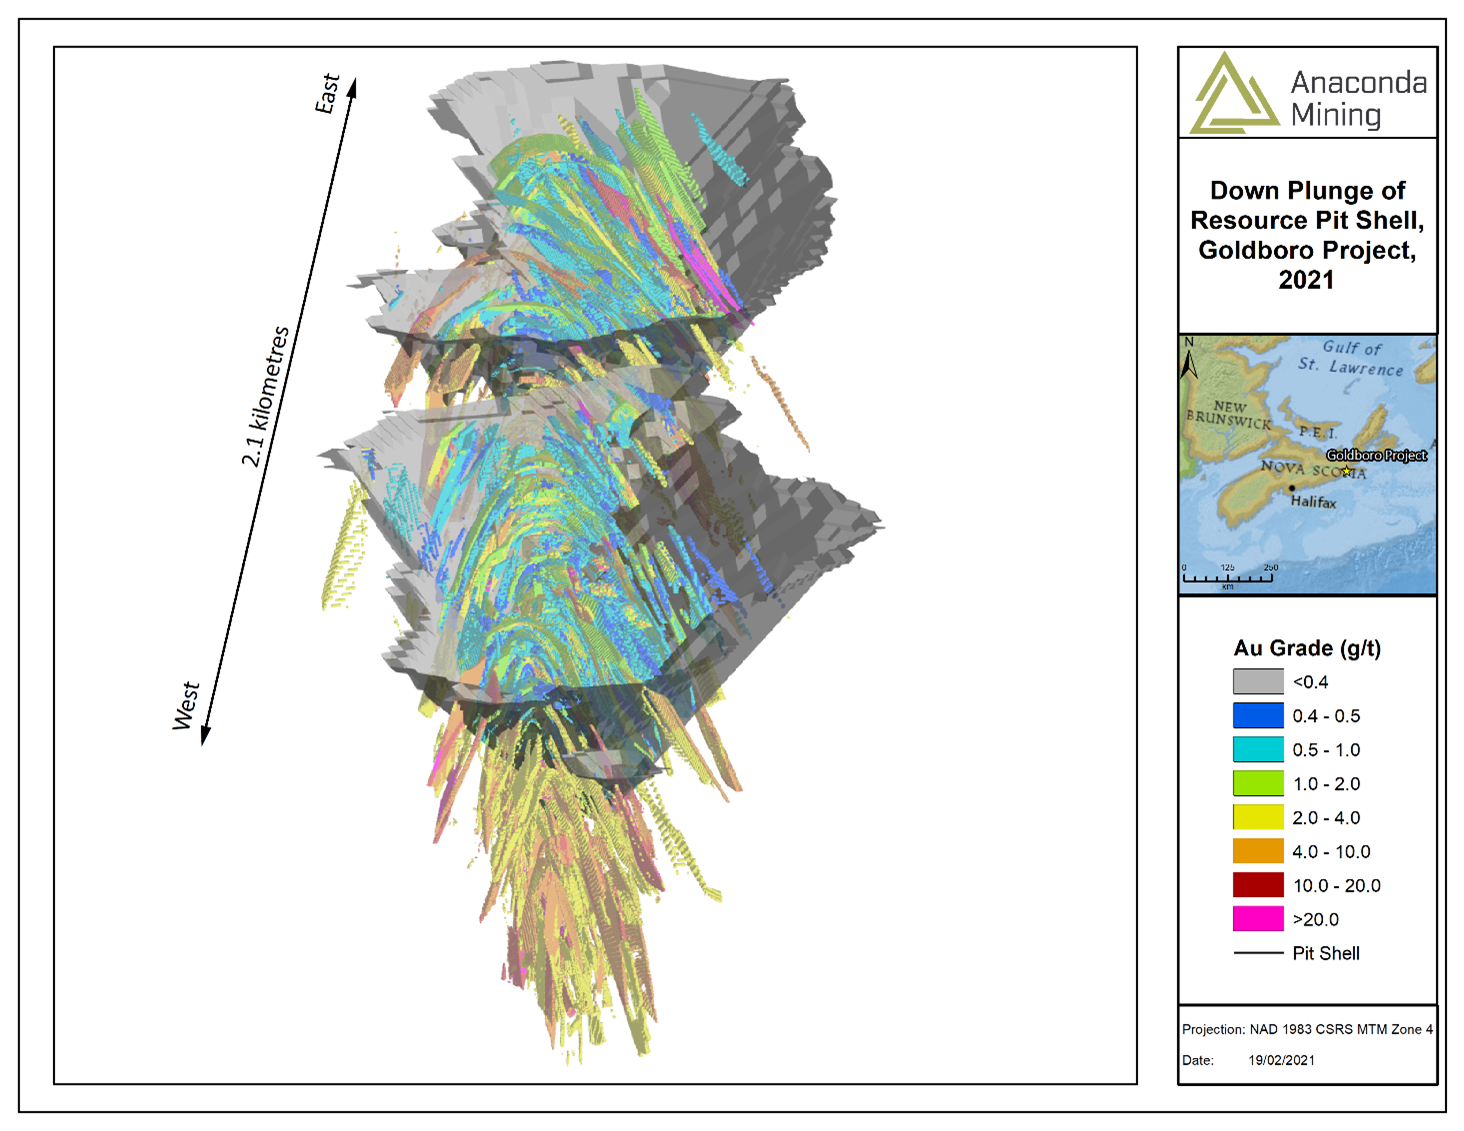
Exhibit E. An oblique view of the Goldboro Deposit looking down the plunge of the anticlinal structure as outlined by the Mineral Resource in relation to the constrained open pits. Viewed above the horizon and looking towards East-Southeast.
SOURCE: Anaconda Mining Inc.
View source version on accesswire.com:
https://www.accesswire.com/631149/Anaconda-Mining-Announces-Significant-Increase-to-the-Mineral-Resources-at-the-Goldboro-Gold-Project
Please make the indicated changes including the new text: US quotes snapshot data provided by IEX. Additional price data and company information powered by Twelve Data.